
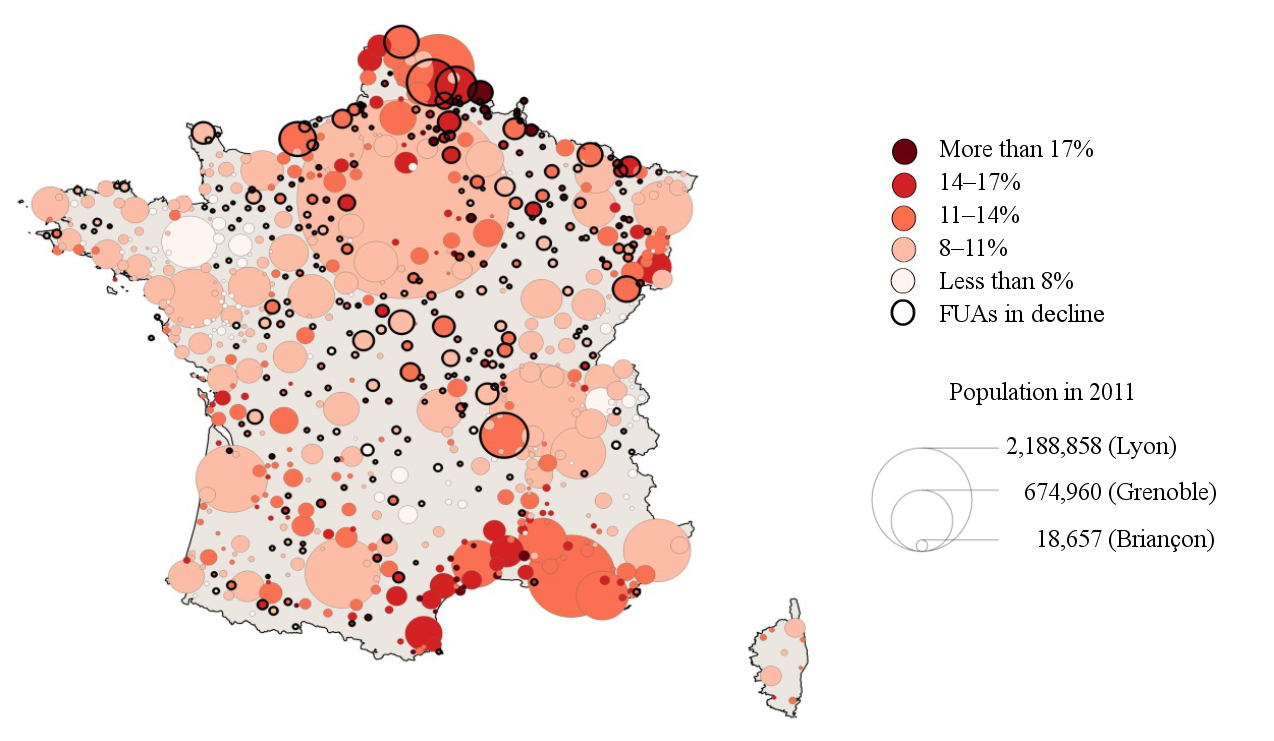
Population decline currently concerns over a third of functional urban areas (FUAs) [1] in mainland France and Corsica: using the zoning defined in 2010 by the French statistics office INSEE, [2] 283 out of France’s 771 FUAs have resident populations that were lower in 2011 than in 1990 (figure 1). The rare works that exist on the subject of urban shrinkage in France all underline the significant role played by migratory dynamics on the one hand and weak rates of natural increase in areas affected on the other (Wolff et al. 2013). This second factor is one reason why urban shrinkage has long remained more limited in France than in other European countries (Oswalt 2006; Steinführer and Haase 2007) – and why political actors, particularly at national level, have had little incentive to take the issue seriously. And yet the image of French cities being protected by high fertility rates does not stand up to scrutiny according to the most recent data. First of all, there are ever clearer links between economic decline and population decline (Friedrichs 1993; Haase et al. 2013). Furthermore, negative migratory dynamics, resulting in particular from the lack of attractiveness of many shrinking cities (Cusin 2014; Rudolph 2015), not only contribute to significant changes in the population structures of these cities, but could also exacerbate shrinkage by adversely affecting birth rates.

[Click on image to enlarge]
Sources: INSEE, 1990 and 2011 censuses.
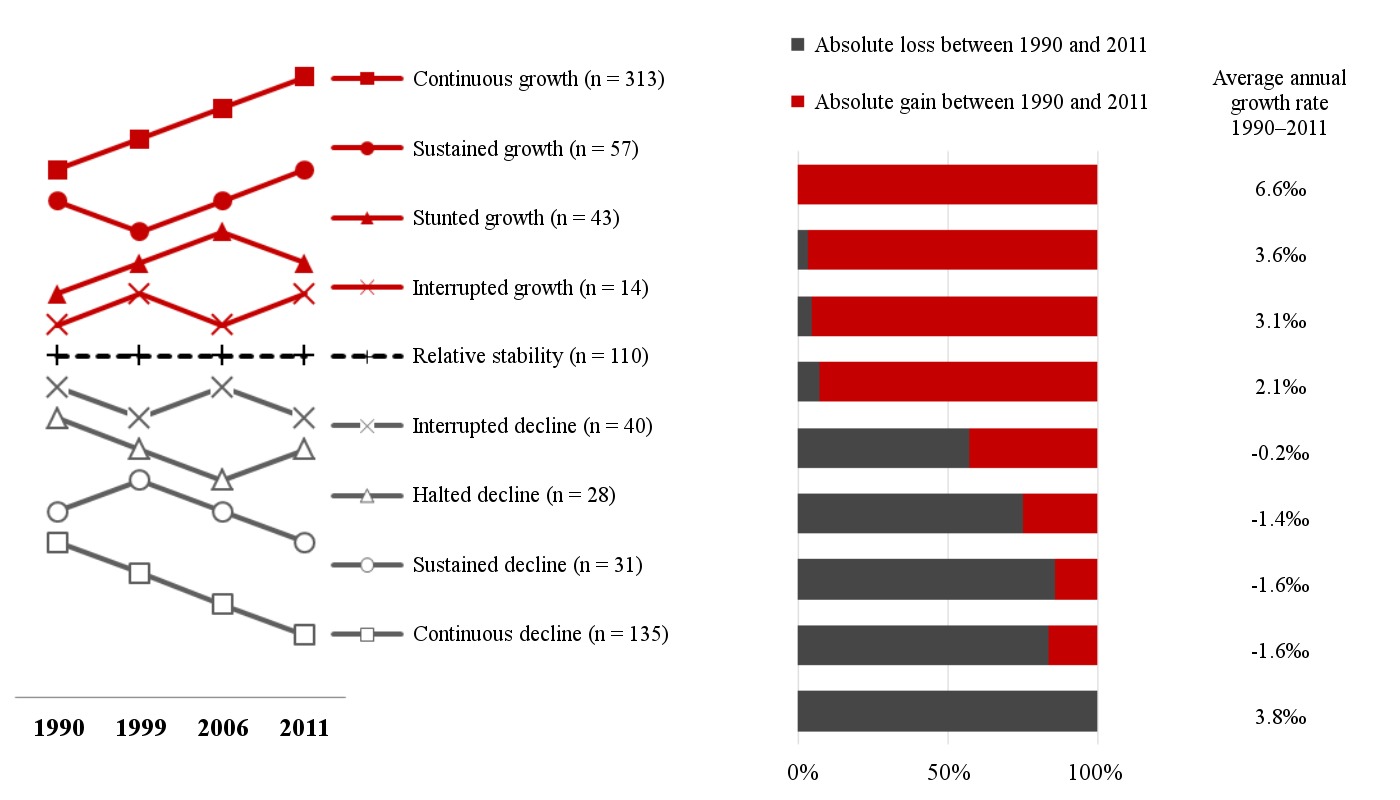
By categorizing the different forms of demographic change that FUAs have experienced in the period from 1990 to 2011, we shall see that economic decline, here considered through the prism of the labour market, may differ in extent and timescale, but brings with it demographic consequences of a similar nature. Four types of trajectories of urban decline can be identified (figure 2). [3] The most common is that of continuous decline, where the population has diminished at each successive census. This concerns the FUAs of Le Havre (in Normandy), Saint-Dizier (in Champagne), Le Creusot (in Burgundy) and Vitry-le-François (also in Champagne), for example. A second type of trajectory, which we have called sustained decline, concerns FUAs where demographic decline began in 1999 rather than 1990. This is the case, for example, in Dunkirk (in northern France), Vittel (in Lorraine) and Argentan (in Normandy). The model of urban decline we have called halted decline refers to FUAs whose populations dropped between 1990 and 2006 but then started to increase thereafter, as in the case of Montbéliard (in Franche-Comté) and Saint-Quentin (in Picardy). Lastly, in cases where FUAs stopped losing population between 1999 and 2006 – as, for example, in Tulle (in Limousin), Lourdes (in the Pyrenees) and Dreux (west of Paris), we can talk about interrupted decline. Of the 234 FUAs concerned by these trajectories of population shrinkage, 19 had more inhabitants in 2011 than in 1990. They are therefore excluded from the analyses that follow. Moreover, we should point out that, by choosing FUAs as our geographical frame of reference, reflecting the functional (as opposed to administrative, political or physical) definition of a city, the internal heterogeneity of processes of decline is not taken into account, which can have the effect of masking periurbanization dynamics – and yet these dynamics play a key role in driving processes of decline in urban centres. [4]
[Click on image to enlarge]
Sources: INSEE, 1990 and 2011 censuses.
When it comes to public debate, size matters
Large FUAs are far less often subject to decline than their smaller counterparts; [6] indeed, over two thirds of shrinking FUAs are small; by comparison, small FUAs make up less than half of all growing or relatively stable FUAs (figure 3). This no doubt partly explains the difficulty involved in getting urban shrinkage on to the political agenda. On the one hand, the population residing in shrinking cities represents less than 10% of the whole urban population in mainland France and Corsica; on the other hand, these small FUAs seem to suffer from a lack of territorial integration. For while small FUAs, shrinking or otherwise, are – like all FUAs in mainland France and Corsica – well integrated into local urban systems (Berroir et al. 2017), they appear to be less well connected to the often multipolar networks that interlink these systems across the country. To put it another way, the decline of these small FUAs is linked more to their distance from FUAs and flows than to proximity to “monster cities” that swallow up wealth and the most highly qualified individuals.

Sources: INSEE, 1990 and 2011 censuses.
Less dynamic labour markets in shrinking functional urban areas
In growing FUAs, the economically active population aged 25 to 54 [7] – defined by the national census as people in work and unemployed individuals – increased by 16.8% between 1990 and 2011, whereas it fell over the same period by 3.3% in declining FUAs. If we consider only people in employment, the figures have also gone in different directions in different FUAs: it has increased by 15.9% in growing cities but dropped by 5.7% in those in decline. These decreases in the number of people in work are not, however, homogeneous among shrinking FUAs: they vary between -1.8%, for those in sustained decline, and -6% to -7%, for other areas. In both cases, the number of unemployed individuals has increased. As declining FUAs will have experienced both a drop in population and a rise in unemployment, they are typically characterized by higher proportions of unemployed people not just among the total population aged 25 to 54 but also among the economically active members of this age group (figure 4). The situation is particularly unfavourable for those FUAs that have been losing population since 1990 or 1999 (i.e. in continuous or sustained decline), with unemployment rates on average three percentage points higher than in growing cities. In the remaining declining FUAs (i.e. in halted or interrupted decline), population loss may have only occurred more recently, but the effects have been more intense (figure 5).
[Click on image to enlarge]
Source: INSEE, 2011 census.

Sources: INSEE, 1990, 1999, 2006 and 2011 censuses.
Productive structures that are still highly specialized
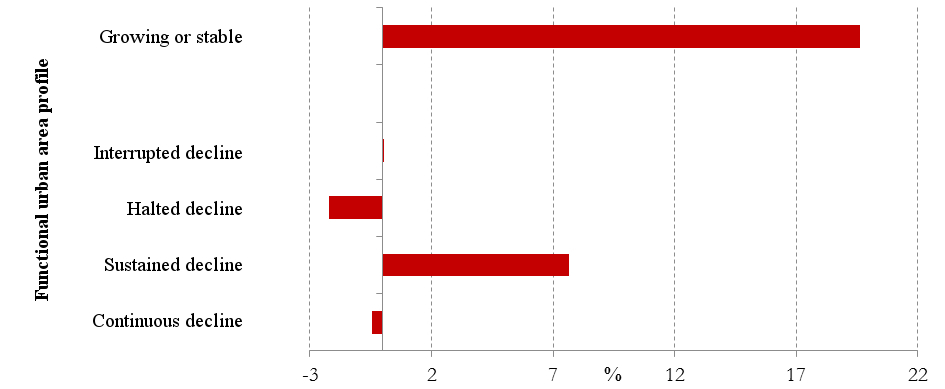
The reduction in the working population in declining FUAs should be considered alongside changes in the amount of work on offer in these areas, here measured in terms of the number of jobs in a particular labour marketplace. [8] For example, while the number of jobs has increased by almost 20% in stable or growing FUAs, it has stagnated in all declining FUAs, with growth standing at 0.3% on average (figure 6). Only FUAs in sustained decline stand out, owing to a lower decrease in the number of manufacturing jobs and a greater increase in the number of public administration and business services jobs. It is for this reason that the reduction in the number of people in work mentioned above is lower in areas in sustained decline than in other types of declining FUA (figure 7). This distinction can, however, be explained in part by the choice of geographical scale of analysis: by choosing FUAs, the internal heterogeneity of the processes in question is masked. Here, we can see the effects of the transformations of labour marketplaces observed since the 1980s and 1990s, particularly in manufacturing, whereby jobs have moved out of city centres in favour of locations on the outskirts of cities (Girard 2014). Indeed, increasing employment in FUAs in sustained decline is linked above all to rising numbers of jobs in periurban areas (+23.1%, compared with +5.9% in urban cores). Similarly, while the number of manufacturing jobs has decreased to a lesser extent in these FUAs than elsewhere, this is essentially because of the significant increases recorded in these periurban communities.
[Click on image to enlarge]
Sources: INSEE, General Census of the Population (Recensement Général de la Population – RGP) 1990 and Renewed Census of the Population (Recensement Rénové de la Population – RRP) 2011.
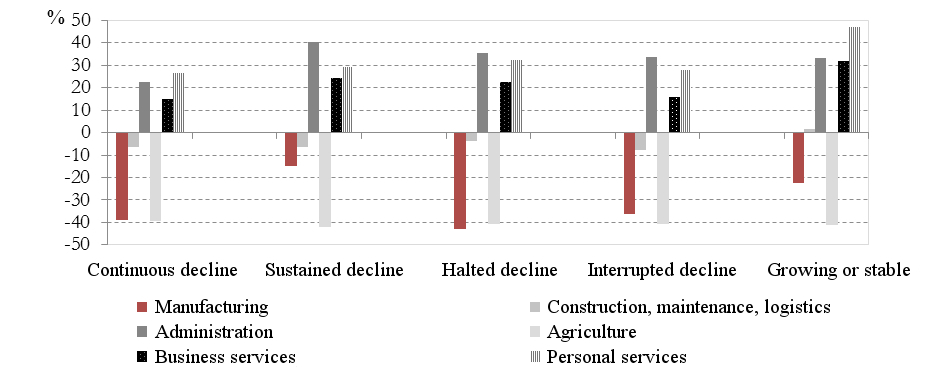
The economic difficulties of declining FUAs can in part be explained by their industrial pasts. For example, while the industrial sector is shrinking overall in France, with a 22.6% reduction in the number of manufacturing jobs between 1990 and 2011, this reduction affected declining FUAs especially acutely: these areas, which had already been hard hit by the crises of the 1970s and 1980s, have experienced a new wave of deindustrialization over the past 30 years.
[Click on image to enlarge]
Sources: INSEE, RGP 1990 and RRP 2011.
However, despite this slowdown in the industrial sector, the proportion of manufacturing jobs is still higher in these cities than in growing FUAs. For example, in cities with halted decline, the industrial sector still accounts for twice as many jobs as in growing FUAs (16.5% compared with 8.1%), despite a 43% reduction in the total number of manufacturing jobs in France between 1990 and 2011. Jobs in sectors such as construction and public works, transport, logistics, maintenance and repairs, and farming are also overrepresented, whereas sectors like distribution and services are less dynamic. Shrinking FUAs can therefore be characterized by the weakness of their presential economies – including activities such as domestic services and retail intended to meet local demand (Davezies 2009; Talandier 2013) [9] – which can be explained, among other reasons, by the greater difficulty involved in attracting those considered to be the drivers of this economy: tourists, retirees and students.
Atypical ageing patterns due to economic decline
The ageing of the population in growing FUAs proves to be relatively conventional: increases in life expectancy lead to “ageing from above” while falling birth rates lead to “ageing from below” (figure 8). In the case of shrinking FUAs, another factor also comes into play, namely a significant decrease in the number of individuals aged 20 to 39. This age group is subject to what could be called “ageing from the middle”, which operates in two phases: a first phase where higher education opportunities and entry into professional life leads to the departure of these age groups and, as a result, an overrepresentation of the oldest age groups; and a second phase where the deficit in this (highly fertile) age group leads to a reduction in birth rates and consequently a hollowing-out of the age pyramid.
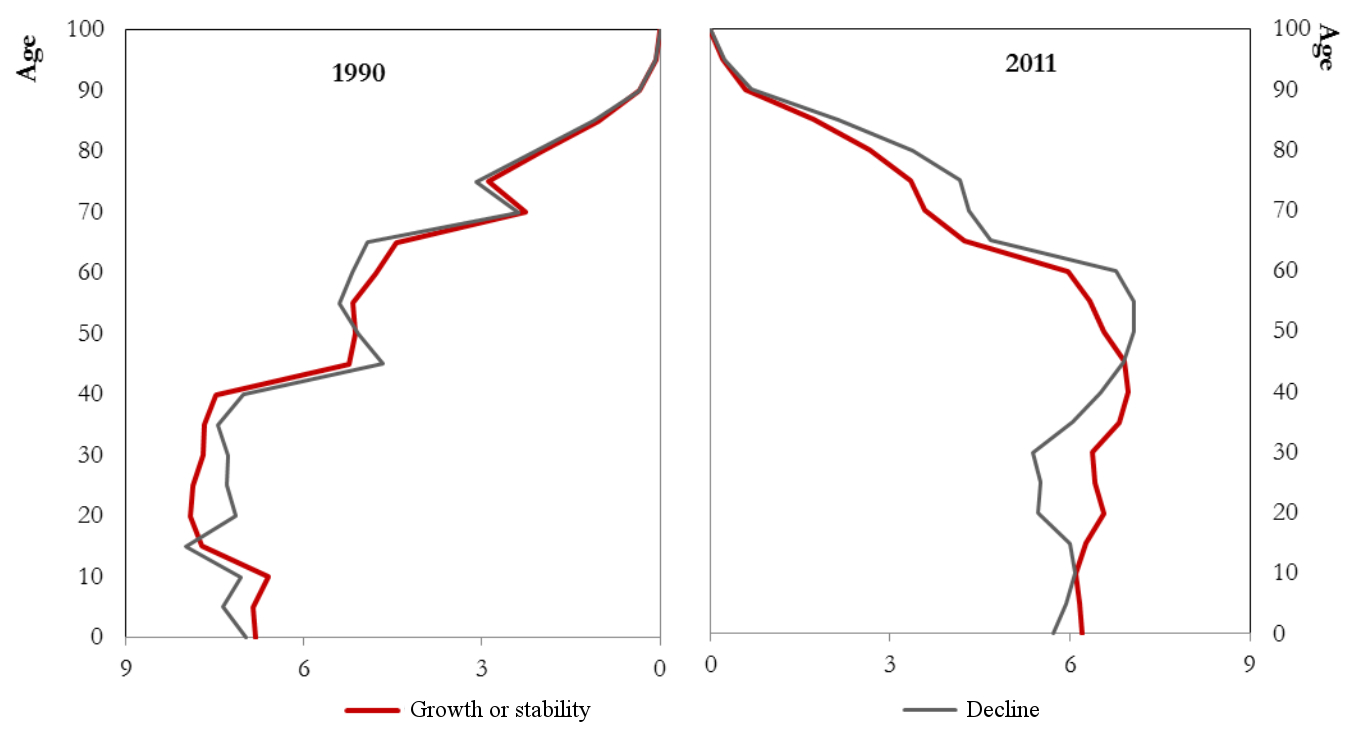
[Click on image to enlarge]
Sources: INSEE, RGP 1990 and RRP 2011.
France’s fertility rate, among the highest in Europe (Mazuy et al. 2014), has until now made it possible to contain the phenomenon of urban shrinkage, owing to a positive rate of natural increase, but this specific form of “ageing from the middle” tends to cancel out the effects of this natural increase. This can be observed in all declining FUAs, but the speed of the process is particularly striking in FUAs in sustained decline (figure 9). In these areas, the rate of natural increase dropped from 5.1‰ in 1990 to 2.3‰ in 2011.
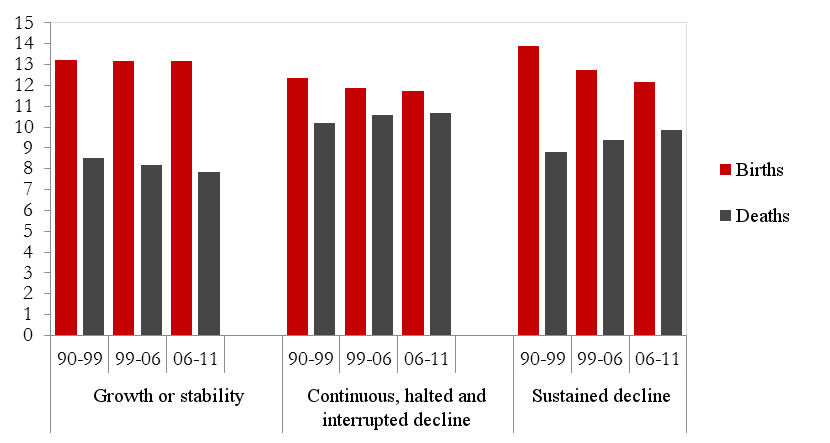
[Click on image to enlarge]
Sources: INSEE, RGP 1990 and 1999, RRP 2006 and 2011; registers of births, marriages and deaths.
Gendered consequences of an industrial past
One of the consequences of declining FUAs’ industrial pasts is that their economically active population is composed of a higher proportion of manual workers and, on average, its members have fewer qualifications. In 2011, some 3 out of every 10 people in work in shrinking cities were manual workers, compared to just 2 in 10 in other FUAs. This socio-economic structure is the result not just of these cities’ lack of attractiveness, but also of a selective residential mobility, as young, skilled individuals of working age are more likely to move away than manual labourers (Rudolph 2015).
The residential mobility patterns of declining FUAs are also characterized by greater numbers of women aged 15 and over choosing to move away, as attested by the higher ratio of men to women [10] in these cities compared to growing FUAs (figure 10). The fact that more women go into higher education and are more employable in the tertiary sector, on the one hand, and the fact that men are more strongly associated with the industrial component of the labour market, on the other, probably explain how these situations arise. In this respect, the inadequacy of university structures – or, more specifically, the mismatch between the courses on offer and local demand – could be contributing both to the lack of attractiveness of declining cities and the transformation of their demographic structures. In FUAs in halted decline, which in 1990 stood out most from the other area profiles, the sex ratio in the 15–24 age group was very similar, in 2011, to ratios observed in growing FUAs. Accordingly, we can put forward the hypothesis that this gendered dimension can also be found in the process of resurgent demographic growth, as, since 2006, women in the youngest age groups, who previously tended to leave these cities, are more frequently choosing to stay.
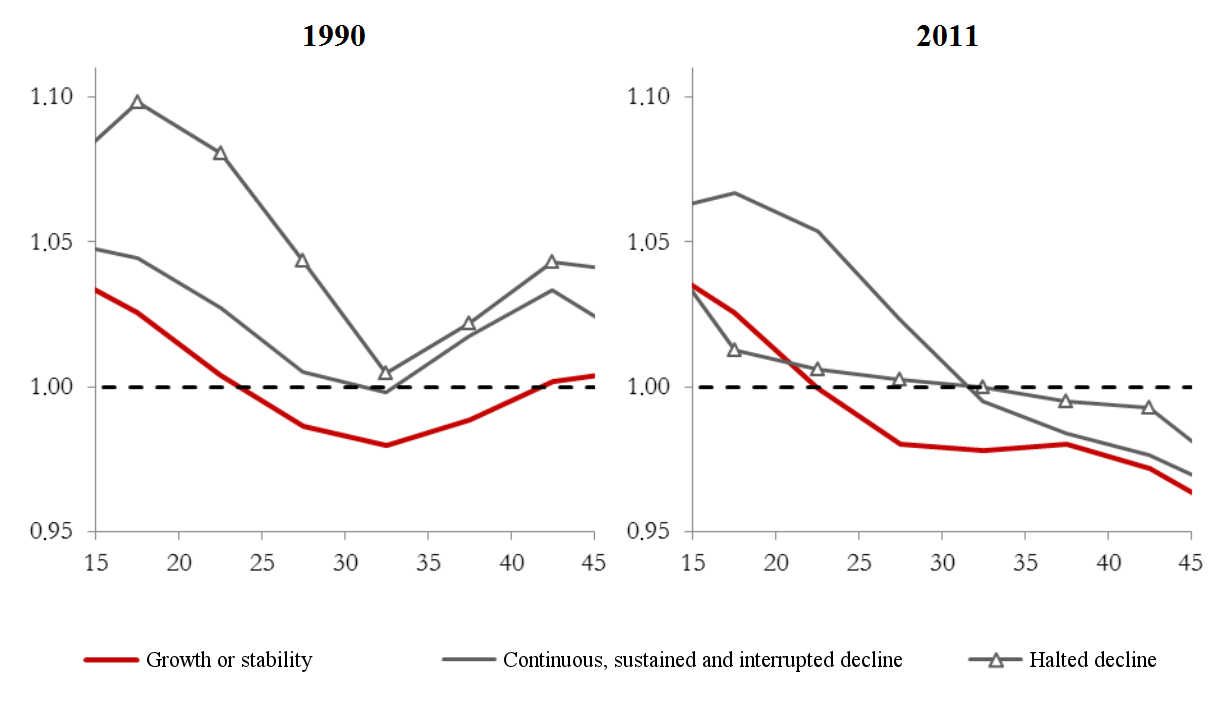
[Click on image to enlarge]
Sources: INSEE, RGP 1990 and RRP 2011.
The end of a French exception?
Today, it seems increasingly difficult to separate the analysis of migratory and natural population changes when seeking to understand the trajectories of French shrinking cities. While it is true that the rate of natural increase is not the primary determining factor of shrinkage as in Eastern Europe (Steinführer and Haase 2007) and Germany (Roth 2011), demographic imbalances in terms of age and gender have nevertheless taken hold. While the ageing of the population could certainly create new jobs in local services, particularly involving the provision of personal care (Cornuau and Devetter 2016), the limited development of the tertiary sector in shrinking cities means that the same will probably not be true with regard to business services, which are broadly underrepresented in these areas, owing to the paucity of higher metropolitan functions and the scarcity of jobs in innovative sectors with high growth potential. As for the gendered differentiation of mobility patterns, this is something that risks creating imbalances on the matrimonial market, which could in turn lead to a drop in birth rates, reinforcing the demographic decline of these cities. In this case, France’s high fertility rate would do little to mask the falling population of its cities and the forgotten dimension of territorial inequality that is urban shrinkage.
Bibliography
- Berroir, S., Cattan, N., Dobruszkes, F., Guérois, M., Paulus, F. and Vacchiani-Marcuzzo, C. 2017. “Les systèmes urbains français : une approche relationnelle”, Cybergeo: European Journal of Geography | Revue européenne de géographie, “Space, Society, Territory” section, document 807, 6 February.
- Cornuau, F. and Devetter, F.‑X. 2016. “Niveau d’offre d’aide à domicile par département : quelles relations avec le vieillissement de la population”, Cahiers de démographie locale 2016, “Dynamiques des populations locales” series, pp. 241–265.
- Cusin, F. 2014. “Les dynamiques urbaines au prisme des mobilités résidentielles longues”, in S. Fol, Y. Miot and C. Vignal (eds.), Mobilités résidentielles, territoires et politiques publiques, Villeneuve-d’Ascq: Presses Universitaires du Septentrion, pp. 65–96.
- Davezies, L. 2009. “L’économie locale ‘résidentielle’”, Géographie, économie, société, vol. 11, no. 2009/1, pp. 47–53.
- Friedrichs, J. 1993. “A theory of urban decline: economy, demography and political elites”, Urban Studies, vol. 30, no. 6, pp. 907–917.
- Girard, V. 2014. “Des classes populaires en recomposition dans le périurbain lointain : analyser les effets croisés de l’accès à la propriété pavillonnaire et des restructurations de l’emploi industriel (1982–1999)”, in J.‑Y. Authier, A. Bourdin and M.‑P. Lefeuvre (eds.), La Jeune Sociologie urbaine francophone, Lyon: Presses Universitaires de Lyon, pp. 85–103.
- Haase, A., Bernt, M., Großmann, K., Mykhnenko, V. and Rink, D. 2013. “Varieties of shrinkage in European cities”, European Urban and Regional Studies, vol. 23, no. 1, pp. 86–102.
- Martinez-Fernandez, C., Weyman, T., Fol, S., Audirac, I., Cunningham-Sabot, E., Wiechmann, T. and Yahagi, H. 2016. “Shrinking Cities in Australia, Japan, Europe and the USA: From a Global Process to Local Policy Responses”, Progress in Planning, no. 105, pp. 1–48.
- Mazuy, M., Barbieri, M. and d’Albis, H. 2013. “L’évolution démographique récente en France : la fécondité est stable”, Population, vol. 68, no. 2013/3, pp. 385–432.
- Oswalt, P. (ed.). 2006. Shrinking Cities, Volume 1: International Research, Ostfildern-Ruit: Hatje Cantz Verlag.
- Roth, H. 2011. “Les ‘villes rétrécissantes’ en Allemagne”, Géocarrefour, vol. 62, no. 2, pp. 75–80.
- Rudolph, M. 2015. Mobilités sélectives et déclin démographique des villes françaises : analyse des flux migratoires à l’échelle des aires urbaines entre 1990 et 2011, second-year master’s dissertation in demography, Université de Strasbourg, 122 pages.
- Steinführer, A. and Haase, A. 2007. “Demographic Change as a Future Challenge for Cities in East Central Europe”, Geografiska Annaler. Series B, Human Geography, vol. 89, no. 2, pp. 183–195.
- Talandier, M. 2013. “Redéfinir l’enjeu de l’économie présentielle et le rôle des femmes dans les économies locales”, Journal of Alpine Research | Revue de géographie alpine, no. 101‑1, “Lever le voile : les montagnes au masculin–féminin | Casting new light on masculine and feminine mountains”.
- Turok, I. et Mykhnenko, V. 2007. “The trajectories of European cities, 1960–2005”, Cities, vol. 24, no. 3, pp. 165–182.
- Wolff, M., Fol, S., Roth, H. and Cunningham-Sabot, E. 2013. “Shrinking cities, villes en décroissance : une mesure du phénomène en France”, Cybergeo: European Journal of Geography | Revue européenne de géographie, “Regional and Urban Planning” section, document 661, 8 December.


