


Following any kind of ballot, electoral maps are sure to proliferate across the media, and the 2012 French presidential election was no exception – especially as computerised electoral results and mapping software are now increasingly accessible. These maps are sometimes produced by enlightened amateurs (notably bloggers) or by academics who are not specialists in political issues. However, many of these maps – which their authors interpret in order to reveal “the principal lessons” (Leroy 2007) to be learnt from the election in question – are in fact of limited scientific interest. Often, they show results on the scale of départements [1] and, at best, distinguish between affluent and poor départements, or between rural and more urban départements, and ultimately highlight regional political cultures without saying anything about the social dynamics upon which these local identities are based.
And yet it is possible to produce maps at municipal level that provide much more detailed and interesting information – the sort of maps that led one demographer, following the 2002 presidential election, to say that he experienced a feeling akin to “discovering the microscope, telescope or scanner” (Le Bras 2002). From this point of view, a new advance has recently been made, as it is now possible to map and analyse results from each individual polling station. [2] Research conducted at this level is rare in France (Girault 2000), even if Paris has, for example, been the subject of some previous studies, conducted at a slightly more detailed level than the city’s 20 arrondissements (city districts), that reveal the electoral manifestation of the historic opposition that structures the capital from the middle- and upper-class west to the working-class east (Goguel 1951; Ranger 1977). The table below gives an initial overview of the electoral profile of the area studied here, compared to France as a whole. It shows the over-representation of votes for the candidates from the largest mainstream parties (Ségolène Royal, François Bayrou and Nicolas Sarkozy).
(% of registered voters)
| Analysis categories [3] | Whole of France | Paris and inner suburbs |
| Abstentions | ||
| Blank/spoiled ballots | ||
| Far Left | ||
| PCF | ||
| Ecologists | ||
| PS | ||
| MoDem | ||
| UMP/Right | ||
| Far Right | ||
| Total |
Despite the major transformations that have been observed in the Paris urban area in recent years, a quantitative typology can be used to take account of the highly diverse polling-district profiles in Paris and the inner suburbs at the time of the 2007 presidential elections. These electoral configurations can then be linked to geographical data concerning social inequalities on an intra-urban scale. It is thus a matter of establishing connections between electoral configurations and the urban social contexts where these configurations are produced, behind the polling-booth curtain.

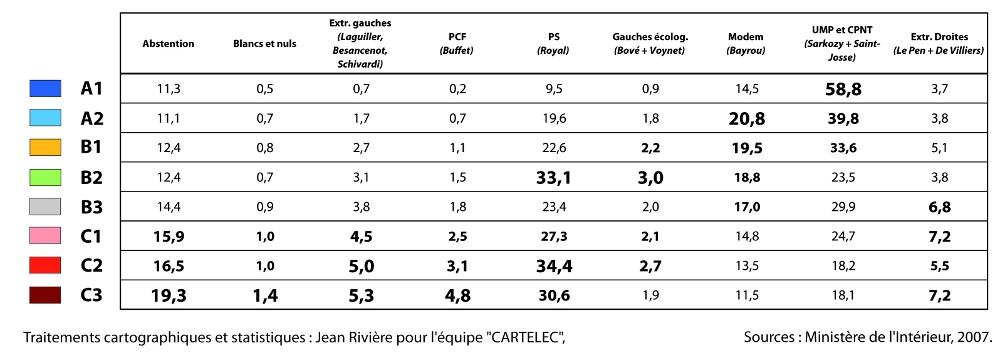
Profiles of types of polling station. The table below shows the scores obtained by the various electoral groupings (% of registered voters). Figures in bold type indicate above-average scores; figures in larger type are the most characteristic values for each of the profiles.
The beaux quartiers
The polling districts that appear in dark blue on the map (type A1), extraordinarily tightly grouped in the 7th (Invalides/Eiffel Tower), 8th (Champs-Élysées/Saint-Lazare) and 16th (Passy/Auteuil) arrondissements in the west of Paris, as well as in the neighbouring town of Neuilly-sur-Seine (and secondarily in upmarket detached housing areas in towns such as Saint-Maur-des-Fossés and Marnes-la-Coquette), clearly illustrate the fact that the bourgeoisie is the last of the mobilised social classes: its members share an awareness of common interests that they wish to preserve, and have the resources necessary to defend them in the political sphere (Pinçon and Pinçon-Charlot 2007a). In these beaux quartiers (smart neighbourhoods), Nicolas Sarkozy and Frédéric Nihous together benefit, on average, from almost 60% of votes cast by registered electors, while all the left-wing and ecologist candidates combined garner only 11% of the vote. [5] An examination of the sociological profile of these polling districts reveals that they are home to a concentration of city-dwellers with the best social resources of all kinds: 40% of inhabitants are aged over 55 and are either retired or at the peak of their professional career; half of the adults in these areas have at least a bachelor’s degree; and 52% of the working population are executives or employed in high-level intellectual professions (to which must be added almost 10% who are employed in liberal professions such as law and medicine, and 17% in intermediate professions). Lastly, half of residents own their own homes, in areas where property prices are among highest in the capital. The median monthly net income among these residents is €3,150 per consumption unit (CU), [6] and the mean monthly income of the richest 10% of households is €8,600 per CU. In spite of the homogeneous and somewhat insular nature of these ultra-rich neighbourhoods (described as “ghettos du gotha” or “jet-set ghettos” by Pinçon and Pinçon-Charlot (2007b)), it is here that social inequalities are most pronounced, as the factor of difference between the richest 10% and the poorest 10% [7] is 11.5, probably owing to the presence of domestic staff employed by the upper classes in these affluent districts.
Type A2 polling districts (in light blue), located in the geographical and sociological continuations of the urbane neighbourhoods mentioned above, surround the historic core of the beaux quartiers (particularly in the 6th (Saint-Germain/Luxembourg), 15th (Vaugirard/Grenelle) and 17th (Batignolles/Ternes) arrondissements) and extend into the Hauts-de-Seine and Val-de-Marne départements. Their electoral profile is close to that of A1 polling districts, albeit with trends that are a little less pronounced, but nonetheless with 40% of votes going to Nicolas Sarkozy and Frédéric Nihous, and, more interestingly, over 20% of voters choosing François Bayrou. The residents of these polling districts belong to social milieux very close to those described in the paragraph above. One notable difference, however, is that A2 polling districts have a larger working population, whereas A1 districts are home to a significant proportion of non-workers (e.g. retired people); this helps to explain the slightly lower proportion of over-55s (33%) in A2 polling districts. Nevertheless, executives and high-level intellectual professions represent 48% of the working population in these areas, while intermediate professions are slightly more present (24%). Here, we are therefore slightly lower down the social hierarchy, as confirmed by the median income of residents in these areas, which stands at €1,850 per CU – only half the equivalent value in the heart of the beaux quartiers, but well above the average for Paris and the inner suburbs.
Intermediate areas
The polling districts shown in orange (type B1) are to be found bordering A2 districts, and more particularly in the central arrondissements of Paris, the Hauts-de-Seine département and the eastern part of the Val-de-Marne département. The MoDem and UMP candidates combined obtained 53% of the vote in these areas – slightly less than in the A2 polling districts. The age structure is closer to the average for Paris and the inner suburbs, although the number of over-55s (31%) is still a little higher than elsewhere. Census statistics show that these are still privileged social environments, even if the ratio between executives (38%) and the intermediate professions (29%) is more balanced, and the education levels obtained a little lower (45% of adults have an academic qualification requiring at least two years’ study at university). Similarly, although 51% of residents here own their main residence, 20% live in rented social housing. This duality can be seen in the interdecile ratio, a mere 6, with a median income of €1,500 per CU. In the Parisian social space, these polling districts form a zone of contact and transition between the wealthy west and the more modest east side of the capital, which has been undergoing major sociological changes since the 1980s.
The geographical distribution of polling districts shown in green (type B2) clearly supports this notion. These areas, which form a crescent sweeping from the western half of the 18th arrondissement (Montmartre) in the north of Paris right round to the 14th arrondissement (Montparnasse/Montsouris) in the south, passing through the 10th (Gare du Nord/Canal Saint-Martin), 11th (Bastille/Oberkampf), 12th (Bercy/Reuilly) and 13th (Gobelins/Tolbiac) arrondissements, are precisely the neighbourhoods concerned by gentrification processes from the 1990s onwards (Clerval 2010). In electoral terms, these polling districts are characterised by an atypical configuration where there is greater support than elsewhere for the Socialist Party (33%) and Ecologist candidates (3%, bearing in mind that “green” parties typically garner very little support in presidential elections), accompanied by a significant proportion of votes for the centrist MoDem party (19%). The list of social indicators for these east-central arrondissements confirms the theory of electoral effects due to gentrification: a significant proportion of the population is in the 18–39 age bracket (49%), with large numbers of students and employed individuals, most of whom work in executive posts and high-level intellectual professions (41%) and in intermediate professions (27%), as well as service-sector posts in insecure situations (fixed-term contracts, temporary work, internships). It is also here that we see the highest proportions of recent homeowners, i.e. for less than 2 years (14%), and tenants in the private rental sector (41%). These intra-urban spaces, which are undergoing significant social change, are therefore places where there is cohabitation between very different social groups, indicated by the locally high level of social inequalities (interdecile ratio of 8.3) and the high median income (€1,850 per CU). More precise data would be required to fully understand these social worlds – and, in particular, a more detailed nomenclature for INSEE’s socio-professional categories. In the meantime, a recent study comparing the social structures and political divides in the 11th and 16th arrondissements helps avoid inappropriate assumptions regarding the supposed electoral preferences of the “Bobo” (bourgeois bohemian) social category, much discussed in the media, who inevitably come to mind when considering the sociological and political make-up of these districts (Agrikoliansky 2011).
The polling districts shown in light grey (type B3), scattered across the eastern parts of the Seine-Saint-Denis and Val-de-Marne départements, are intermediate areas separating more polarised electoral profiles. These polling districts are therefore very close to the average for Paris and the inner suburbs in electoral terms; the only distinguishing factors are Far Right and Far Left scores that are slightly higher than elsewhere. Here, inhabitants in the 40–64 age group are very slightly over-represented (41%), as are the intermediate professions (28%), who are present alongside a similar number of service-sector workers (29%). And so as we move away from the centre of the capital, we gradually descend the social ladder, as confirmed by other indicators: the median income, for instance, is €1,180 per CU, and it is in these areas that social inequalities are the least pronounced (with an interdecile ratio of 5.7). A majority of adults (52%) have qualifications below the level of the baccalauréat (the school-leaving certificate typically obtained at age 18) in these polling districts, and many residents have been in the area for a long time (43% of inhabitants have lived there for more than 10 years). Similarly, there is a high proportion of homeowners (52%), most of whom live in detached houses on estates further out.
Outlying working-class districts
The polling districts in pink on the map (type C1) represent poorer areas and – with the exception of a few polling districts in the 18th, 19th and 20th arrondissements in the north-east of Paris proper – are all located in départements beyond the Paris city boundary. Here, it is abstention rates (16%) that are slightly above average, along with numbers of blank and spoilt ballots and support for the Far Left and Far Right, although the figures for these various electoral behaviours are actually quite low in absolute terms. Inhabitants in the 40–54 age bracket (27%) are very slightly over-represented in these polling districts, as are the unemployed working-age population (13%) and (pre-)retirees (6%). The proportion of adults that have not obtained their baccalauréat (58%) is higher than for the B3 profile, and the employed working-age population is here divided above all between service-sector workers (33%), the intermediate professions (26%) and manual workers (19%). The median income is €1,080 per CU, and the number of adults receiving housing benefit (13%) or the RSA (revenu de solidarité active, a form of income support) (5%) is a little higher than in the rest of the inner suburbs. Although the town of Gonesse is just outside the perimeter studied here (being located in the Val-d’Oise département), the categories evoked here are typical of the “petits-moyens” (people with small incomes) highlighted by an ethnographic study carried out in this outer suburb (Cartier et al. 2008). Almost 70% of residents in these polling districts have lived there for more than 5 years, and the proportion of private-sector tenants is low (20%), which means that homeowners (42%) and social-housing tenants (38%) live alongside one another in more or less equal proportions.
Type C2 polling districts, shown in red, are those that are most supportive of the various left-wing parties. They are located in areas in the east of Paris that have so far resisted gentrification (Clerval 2010), and above all in parts of the northern inner suburbs (such as Gennevilliers, Saint-Denis and Montreuil) and the area to the south of Paris around Ivry-sur-Seine and Vitry-sur-Seine – two historic centres of the former “red belt” of communist suburbs. It is in these areas that scores for the Socialist Party (34.5%) are highest, accompanied by relatively good results for the “critical left” (5% for the Far Left, 3% for the Communist Party), as well as quite high rates of abstention and blank/spoiled ballots. Inhabitants under 40 represent about half the population here, where 36% of adults have no qualifications (or only a certificate of primary education), and where the unemployed represent 13% of the working-age population. Among the employed working-age population, the most significantly over-represented groups are service-sector workers (35%) and manual workers (21%), which helps explain the relatively low median income level (€1,150 per CU). The proportion of beneficiaries of various social redistribution measures is high here: 48% of residents are social-housing tenants, 17% of adults receive housing benefit from the family allowance office, and 7% receive the RSA.
Finally, the polling districts shown on the map in maroon (profile C3) form the last group in this typology. They comprise urban neighbourhoods in large social-housing estates in the north of Seine-Saint-Denis (in particular in Aubervilliers, La Courneuve and Bobigny) and in the south of Val-de-Marne (in particular around Villeneuve-le-Roi and Villeneuve-Saint-Georges). They are distinguished above all by high abstention rates (19%). Although this abstention rate may seem rather low, it should be borne in mind that the first round of the 2007 presidential election was – with an average abstention rate of 16.2% nationally and just 14% in Paris and the inner suburbs – one of the most intense ballots in recent history in France. As the long-term study conducted on the Cosmonautes social-housing estate in Saint-Denis (Braconnier and Dormagen 2007) shows, the social determinations that imperil voter turnout are all the greater when mobilisation levels during elections low. Abstentions aside, the various left-wing groupings (Socialist Party, Communist Party and Far Left), as well as the Far Right, recorded significant scores in these polling districts. To understand these choices, a study of the social statuses of adults aged 15 to 64 is particularly enlightening: only 60% are of working age and employed, 12% are unemployed, 12% are undertaking unpaid internships, 5% are (pre-)retirees and 11% belong to the statistical category of “other members of the non-working population”. The employed working-age population is composed above all of service-sector workers (39%) and manual workers (25%), while a further 15% are in insecure employment situations (fixed-term contracts, temporary work, internships). These areas are therefore above all home to predominantly young people who often have few qualifications, as well as a high proportion of residents who are long-term unemployed or, in case of those with jobs, who are low down on the career ladder. It therefore comes as little surprise to learn that the median income in these areas is just €900 per CU, and that the relatively low level of inequality (indicated by an interdecile ratio of 7) seen in these polling districts in fact masks the very low level of incomes of those who, locally, are among the richest 10% (€1,760 per CU) and, above all, the poorest 10% (€270 per CU). Furthermore, it is in these areas that residential mobility levels are lowest: 45% of residents have occupied their current home for more than 10 years and 58% of residents live in rented public housing.
Ultimately, this overview helps to clarify the electoral configurations present in Paris and its inner suburbs by clearly placing them within the social contexts where they are produced, from the richest neighbourhoods to the poorest social-housing estates, via the polling districts of gentrified Paris. Although the Paris urban area is a place where the social and political contrasts between neighbourhoods are accentuated compared to smaller towns and cities, it is not unreasonable to suppose (bearing in mind the notion of ideal type) that the rationales revealed by this typology can also be found to some extent in the majority of French urban areas. Accordingly, when the scale of analysis is sufficiently detailed, and when the trap of “spatialism” is avoided, cartographic approaches that analyse voter choices in conjunction with their contextual social determinants would seem to be more relevant now than ever. They make it possible to refute the rhetoric of a number of established political commentators, who refute approaches that favour the social embedding of electoral preferences, too often deemed to be “sociological and backward-looking” (Lehingue 2001). Let us hope that this pitfall will be avoided in the weeks following the elections...
Bibliography
- Agrikoliansky, É. 2011. “« Bourgeois » contre « bohèmes » ? Transformations sociales et clivages politiques dans deux arrondissements parisiens”, in Agrikoliansky, Heurtaux and Le Grignou (dir.), Paris en campagne. Les élections municipales de mars 2008 dans deux arrondissements parisiens, Bellecombe-en-Bauges: Éditions du Croquant, pp. 35–78.
- Braconnier, C. and Dormagen, J.-Y. 2007. La démocratie de l’abstention. Aux origines de la démobilisation en milieu populaire, Paris: Gallimard.
- Cartier, M., Coutant, I., Masclet, O. and Siblot, Y. 2008. La France des « petits-moyens » : enquête sur la banlieue pavillonnaire, Paris: La Découverte.
- Clerval, A. 2010. “Les dynamiques spatiales de la gentrification à Paris”, Cybergeo: European Journal of Geography.
- Goguel, F. 1951. “Structure sociale et opinions politiques à Paris d’après les élections du 17 juin 1951”, Revue française de science politique, vol. 1, no. 3, pp. 326–333.
- Le Bras, H. 2002. Une autre France. Votes, réseaux de relations et classes sociales, Paris: Odile Jacob.
- Lehingue, P. 2000. “Sociologie critique”, in Perrineau and Reynier (dir.), Dictionnaire du vote, Paris: Presses universitaires de France, pp. 856–861.
- Leroy, S. 2007. “Les principaux enseignements du 1er tour de l’élection présidentielle de 2007 en cartes”, Cybergeo: European Journal of Geography.
- Pinçon, M. and Pinçon-Charlot, M. 2007a. Sociologie de la bourgeoisie, Paris: La Découverte.
- Pinçon, M. and Pinçon-Charlot, M. 2007b. Les ghettos du gotha. Comment la bourgeoise défend ses espaces, Paris: Le Seuil.
- Ranger, J. 1977. “Droite et gauche dans les élections à Paris : le partage d’un territoire”, Revue française de science politique, vol. 27, no. 6, pp. 789–819.


