


Over the past decade, “redlining” has received increasing attention in the popular press and across academic disciplines. Redlining, or the discriminatory practice of denying financial services to residents of specific geographic areas based on their racial composition, remains one of the most well-known forms of spatial racism in the US, and one early example of the role of race in data-driven urban governance. Though it is an artifact of its time, the boundaries of early redlining maps are actively applied to present day urban analyses despite the changing geographies of segregation and data-driven racism in the US. While redlining is important to understand in the historiography of racism, this ongoing search for legacy impacts of redlining overdetermines contemporary outcomes of past practices while missing the suite of policies and practices that informed spatial racism at that time and today. The spatial racism behind redlining in the 1930s was not new; it grew out of existing retail racism and restrictive racial housing covenants. Moreover, it did not disappear with an archiving of the infamous Home Owners’ Loan Corporation (HOLC) maps—redlining tactics are redeployed with current advances in technology. It is the embedded racism within institutions and their policies that remains the legacy to be examined and challenged as new data-driven practices continue to reproduce inequitable opportunity in US cities.
“Redlining” is a metaphor for the spatial racism embodied by the Federal Housing Administration (FHA) and banks from the 1930s to the 1970s, when this form of lending discrimination was declared illegal. The term was coined by John McKnight, Midwest Director of the US Commission on Civil Rights, while working with Dr. Martin Luther King Jr.’s staff in Chicago (Finley 2016). McKnight analyzed systematic discrimination in lending that excluded Black Americans from getting home mortgages. Contemporary researchers often focus on redlining terminology but fail to study the associated racist spatial practices. McKnight, by contrast, viewed redlining as one of many pernicious forms of spatial racism, including blockbusting and land contracts.
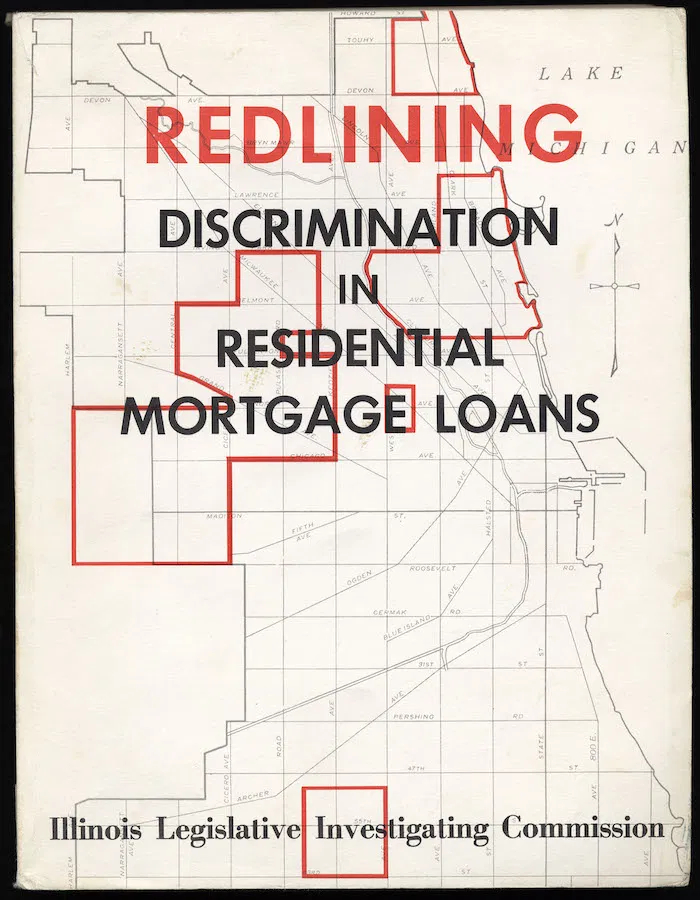
The report cover mirrored the redlined areas of Chicago, one of the only cities with a redlining map that was not destroyed.
Racism has long been a default feature of institutions in the United States. In his critique of Richard Rothstein’s The Color of Law, David Imbroscio notes that the practitioners of redlining were acting prudently, “given that it was the near-ubiquitous racism that constructed the very market values that redlining practices reflected” (Imbroscio 2020, p. 32). In a recent study of Baltimore, researchers found that areas of the city experiencing food access issues were not formerly redlined areas. In fact, the areas of the city that experienced redlining had better food access due to subsequent gentrification. At the same time, areas that experienced blockbusting faced greater food access issues, including the lack of nearby grocery stores (Sadler et al. 2021).
New research has discovered and geolocated historic FHA mortgage records in order to drill down on the impact of home loans. This work was necessary as the FHA destroyed nearly all of their redlining records after a lawsuit in 1969. Economist Price Fishback and colleagues (2021, 3) show that the FHA had been implementing its own redlining practices prior to the existence of any of the HOLC color-coded maps. Edwin C. Daniel described redlining best in 1975 as the “red pencil of financial institutions” (Daniel 1975). This work builds on McKnight’s conception of the multitude of tactics generating spatial racism, where the red pencil of financial institutions extended well beyond HOLC “grade D” neighborhoods to include areas where blockbusting and land contracts were common practices. Racial prejudice in mortgage lending did not end with Home Mortgage Disclosure Act (HMDA) reporting requirements. Land contracts and predatory lending continue to rob Black homeowners of their properties and potential (Akers and Seymour 2018).
When we think of redlining as a historical phenomenon encapsulated in one set of maps, we miss the larger story of spatial racism that existed before the maps and persists to the present day. The term “redlining” may have been expedient at times but is only one element in a broader examination of the impact of racism across all facets of society. The utility of data for categorization is powerful, but to understand spatial racism in an urban setting, one must attend to how the data is produced and distributed in both informal decision-making and official policy.
Reverse redlining to the great recession
By the early 2000s Detroit was a majority-Black city with a population of just under 1 million people. Formerly redlined areas of Detroit had been razed, redeveloped, or remained vacant. The issue was no longer the racialized targeting of specific areas of Detroit, but the writing off of a majority Black city. National chain retailers, internet service providers, as well as banks and manufacturing all avoided the city limits (Hill 2014).
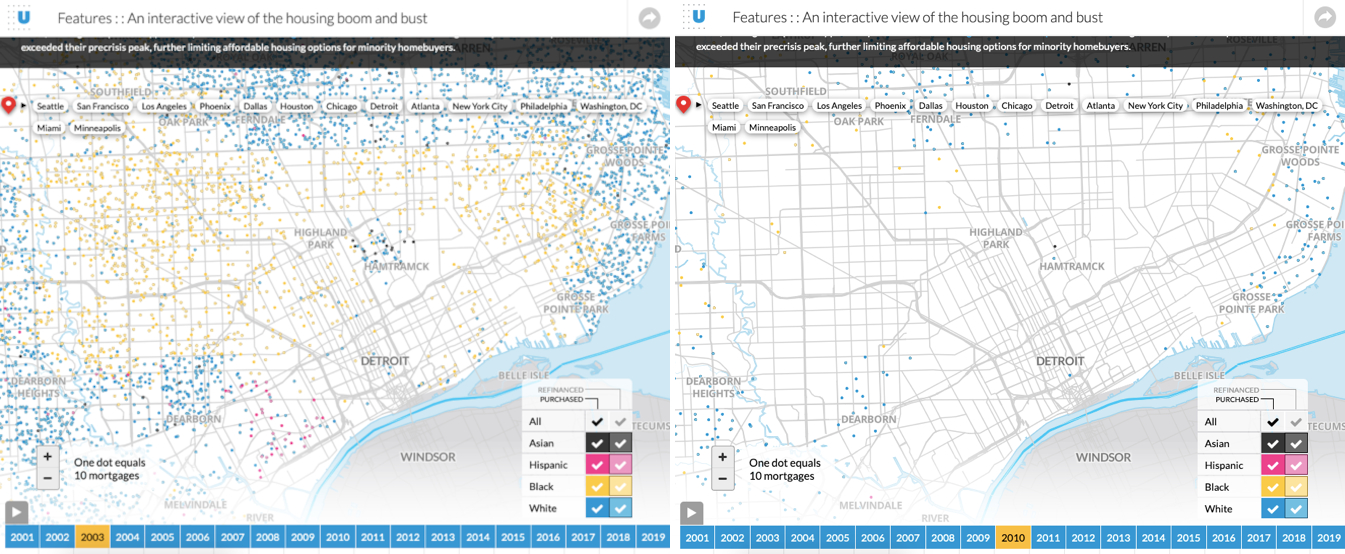
The map on the left for 2003 shows extensive subprime lending to Black and Hispanic Detroiters while the map on the right for 2010 shows only a few mortgages in the entire city.
Redlining was not the predominant issue during the 2007–2008 Great Recession, but rather “reverse redlining” or what is occasionally referred to as “greenlining.” Subprime mortgage lenders targeted Black homeowners across the city, which led to thousands of Black Detroiters losing their homes to mortgage and tax foreclosure. In 2012, the ACLU settled a racial discrimination case against Morgan Stanley, whose subsidiary, New Century Mortgage Corporation, sold subprime mortgages to nearly 6,000 Black homeowners in Detroit (ACLU 2012).
The Urban Institute analyzed reverse redlining in cities across the US and found disproportionate effects on Black and Hispanic households. They tracked mortgages using HMDA data from 2001 until 2012 and demonstrated the extent of subprime lending in Detroit, from thousands in the early 2000s to nearly zero mortgages by 2010 (HFPC/Urban Institute 2020). Their interactive map depicts racially concentrated neighborhoods flooded with subprime mortgages in the early 2000s; these same neighborhoods appear blank on the map by the 2010s with no mortgages given. By 2018, just one in five Detroit home sales involved a mortgage (Kurth 2018).
Retail racism’s roots and bluelining
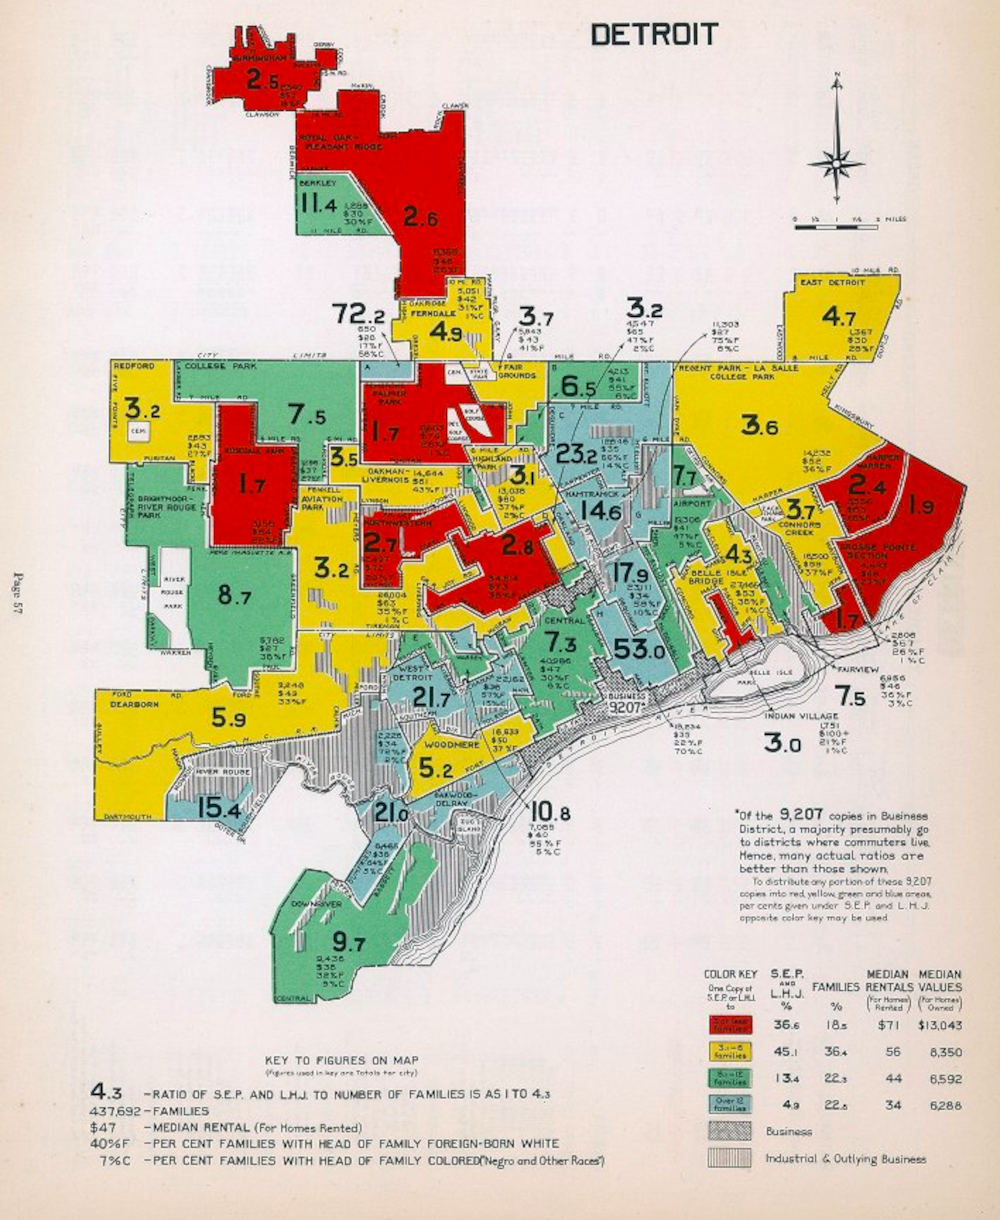
Source: David Rumsey Map Collection.
For nearly a century, retailers have used neighborhood classifications to avoid majority Black neighborhoods. The practice of “bluelining” is likely one of the earliest examples of retail spatial racism. Beginning in the 1920s, the Curtis Publishing Company and its newly established market research department developed a data-driven market analysis to develop maps for its door-to-door salesmen. It utilized variables such as circulation data for newspapers and magazines, auto sales, consumer goods, and transportation spending in order to classify neighborhoods. These maps targeted specific neighborhoods and expressly avoided others:
“[…] manager was instructed to conduct circulation work in the better residential areas (colored red and yellow on the Survey map). He was forbidden to do work in areas colored blue (for the most part with foreign-speaking or colored residents).” (1932, p. 5)
The supermarket and grocery sector is one of the clearest examples of retail discrimination. As racial demographics shifted to majority Black inner cities and urban centers, retailers began pulling out. In one Michigan case, the Kroger corporation bought competitor Great Scott’s supermarket stores in the 1990s, promptly selling off locations inside the Detroit city limits while keeping all suburban stores. Kroger has not operated a grocery store inside Detroit even as other chain supermarkets have returned and expanded (Hill 2020). In a 2014 radio interview, the former Director of the Detroit Economic Growth Corporation argued racism, not economics, was the reason national retailers were not located in Detroit (Thompson 2014):
“... it’s called racism. Detroit has been redlined in a number of instances by a number of different types of businesses, particularly retail. I can show you where demographics in the City of Detroit were stronger than a nearby suburb, but yet those big box stores, until recently, or that decision was made to go elsewhere [...] it’s not about an economic model, it’s about race.”

Source: Vaccine Spotter (website no longer exists).
More recently, the impact of retail redlining in majority Black cities is seen in the COVID-19 pandemic response. In Michigan, cases and deaths were concentrated among Black populations. Yet the State of Michigan selected chain grocers Kroger and Meijer as well as CVS as their primary partners in vaccine distribution. Those retailers had limited to no presence in the Black communities most in need due to retail redlining (Hill 2021).
Tech-inspired spatial racism
A 2021 report by the Electronic Frontier Foundation argues that Big Tech has advanced spatial racism (Falcon 2021). Tech startups operating in the housing space seem to gravitate most quickly to neo-redlining practices, while other tech companies employ spatial racism as a “fun” and crowdsourced activity. In an uncanny recreation of the HOLC maps, BiggerPockets, a startup with a mission to help anyone “build wealth through real estate,” provides A through D letter grades and green to red color coding for neighborhoods worth an investment in Cleveland and Indianapolis (Wise 2017; White 2018). PicketReport, a Detroit-based startup that helped new home buyers explore neighborhoods, employed a tool called the “rank-o-matic.” The resulting ranks included racially biased terms like “Struggling Societies,” “Soul Survivor,” or “Ciudad Striver.” HoodMaps—which tries to sell users a connection to AirBnB, Bookings.com, or a Google search for nearby hotels—allows users to give a thumbs up or down for a neighborhood as well as select from various white-presenting categories like “Suits, Rich, Tourist, or Hipsters.” The interactive mapping site also allows a user to add text over areas of cities, which become racial/ethnic flags to avoid certain areas.

Source: BiggerPockets (www.biggerpockets.com).
Growing reliance on crowdsourcing data, in which users are meant to rank “safety,” also leads to racist results. A Detroit-based startup, CitySketch, meant to build a database of safety, allowed users to submit “sketchy” areas of a city that they were not comfortable walking in. The result was a database of spatial racism from its users, when black neighborhoods were defined as sketchy, and not predominately white neighborhoods. Similarly, sites like Nextdoor, which is meant to connect neighbors in an online platform, have seen countless incidents of Black Americans silenced while discussing race on the platform (Fink 2021). New programs, like the Neighbors app from Amazon’s Ring camera, create opportunities for crowd sharing of stereotypes by racially profiling Black Americans (Lustbader 2019). These reports and incidents become a new dataset used to inform the next tool, algorithm, or police response. This uncontested adoption of spatial racist practices is a much an indictment of the apolitical or asocial approach to data within the tech sector as it is indicative of the structural racism evident within all aspects of American life.
The continuity of spatial racism
Spatial racism is built into capitalism (Gilmore 2007) and specifically the US real estate market. Redlining was not the first example, nor will it be the last, as new technologies make it all too easy for anyone with a smartphone to discriminate or inadvertently assist in building a racially prejudiced neighborhood map. Data-driven approaches to neighborhood classification are built to categorize and, as currently constructed, discriminate. These practices will continue to perpetuate spatial racism without a deeper engagement with the legacy of structural racism embedded in institutions and their policies.
Spatial racism did not appear in the 1930s with the creation of a set of maps, and it did not disappear after those maps became historical. Redlining must be understood in the historiography of spatial racism—if we do not understand it as an artifact we are missing the myriad of ways in which racism shapes space and takes place. It is not the map or the fixed geography of grading in HOLC maps that are important, but instead what these maps and other practices tell us about the ways in which racism is deployed through the mundane use of data and its presentation, and the scaffolding of policy and institutional practice that support segregation. This is important as financial institutions have continually used race and geography to withhold fair lending while flooding these same areas with predatory instruments. It is essential because policymakers consistently call for “data-driven” practices that too often produce the same disparate outcomes for Black Americans as redlining, bluelining, and greenlining.
The practices that institutions formed into redlining are being reconstituted in the current technological era. The legacy of racism needs to be the focus of examination within data-driven practices that inevitably reproduce inequitable neighborhood resource access and opportunity. The greatest disservice in fetishizing redlining is done to those most affected by historical and current spatial racism. Tracking and measuring racism is difficult but essential if history is to be understood, and present-day racist policies are to be dismantled.
Bibliography
- American Civil Liberties Union (ACLU). 2012. Morgan Stanley Sued for Racial Discrimination in Pushing Predatory Loans to Black Homeowners [online], 15 October. Accessed 1 November 2021, URL: www.aclu.org/press-releases/morgan-stanley-sued-racial-discrimination-pushing-predatory-loans-black-homeowners-0.
- Akers, J. and Seymour, E. 2018. “Instrumental exploitation: Predatory property relations at city’s end”, Geoforum, no. 91, pp. 127–140.
- Curtis Publishing Company. 1932. City Markets: A Study of Thirty-Five Cities, Philadelphia: Curtis Publishing Company – Advertising Department.
- Fink, K. 2021. “Can Nextdoor Solve Its Racism Problem?”, 1A – WAMU 88.5/NPR, 22 April. Available online at the following URL: https://the1a.org/segments/nextdoor-karen-problem.
- Falcon, E. 2021. “The FCC and States Must Ban Digital Redlining”, Electronic Frontier Foundation [online], 11 January. Accessed 1 November 2021, URL: www.eff.org/deeplinks/2021/01/fcc-and-states-must-ban-digital-redlining.
- Finley, M. L., Lafayette, B., Ralph, J. R. and Smith, P. (eds.). 2017. “The Chicago Freedom Movement: Martin Luther King Jr. and Civil Rights Activism in the North”, Journal of Southern History, vol. 83, no. 2, pp. 473–475.
- Fishback, P. V., Rose, J., Snowden, K. A. and Storrs, T. 2021. New Evidence on Redlining by Federal Housing Programs in the 1930s, report no. w29244, Cambridge (Massachusetts): National Bureau of Economic Research.
- Gilmore, R. W. 2007. Golden Gulag, Berkeley: University of California Press.
- Heppler, J. A. 2017. “American Panorama: An Atlas of United States History”, The Journal of American History, vol. 103, no. 4, pp. 1120–1121, March. DOI: https://doi.org/10.1093/jahist/jaw624.
- Hill, A. B. 2014. “Map: The Empty Business Rings of Detroit”, DETROITography [online], 8 November. Accessed 1 November 2021, URL: https://detroitography.com/2014/11/08/map-the-empty-business-rings-of-detroit.
- Hill, A. B. 2020. “Map: Chain Supermarkets in Metro Detroit 2020”, DETROITography [online], 26 June. Accessed 1 November 2021, URL: https://detroitography.com/2020/06/26/map-chain-supermarkets-in-metro-detroit-2020.
- Hill, A. B. 2021. “Map: Retail Redlining and COVID-19 Vaccine Availability”, DETROITography [online], 24 March. Accessed 1 November 2021, URL: https://detroitography.com/2021/03/24/map-retail-redlining-and-covid-19-vaccine-availability.
- Imbroscio, D. 2021. “Race matters (even more than you already think): Racism, housing, and the limits of The Color of Law”, Journal of Race, Ethnicity and the City, vol. 2, no. 1, pp. 29–53; first published online on 9 December 2020. DOI: https://doi.org/10.1080/26884674.2020.1825023.
- Kurth, J., 2018. “Banks are lending again in Detroit… if you live in the right neighborhood”, Bridge Michigan [online], 15 March. Accessed 1 November 2021, URL: www.bridgemi.com/urban-affairs/banks-are-lending-again-detroitif-you-live-right-neighborhood.
- Lustbader, S. 2019. “Spotlight: Neighborhood Crime Apps Stoke Fears, Reinforce Racist Stereotypes, and Don’t Prevent Crime”, The Appeal [online], 4 June. Accessed 1 November 2021, URL: https://theappeal.org/spotlight-neighborhood-crime-apps-stoke-fears-reinforce-racist-stereotypes-and-dont-prevent-crime.
- Marchiel, R. K. 2020. After Redlining: The Urban Reinvestment Movement in the Era of Financial Deregulation, Chicago: University of Chicago Press.
- Sadler, R. C., Bilal, U. and Furr-Holden, C. D. 2021. “Linking historical discriminatory housing patterns to the contemporary food environment in Baltimore”, Spatial and Spatio-Temporal Epidemiology, vol. 36, February, art. 100387. Available online at the following URL: www.sciencedirect.com/science/article/pii/S1877584520300654. DOI: https://doi.org/10.1016/j.sste.2020.100387.
- Thompson, B. 2014. “Community Benefits Ordinance: Necessary or Not?”, Detroit Today, WDET, 20 November. Available online at the following URL: http://archives.wdet.org/shows/detroit-today/episode/community-benefits-ordinance-112014.
- United States Federal Housing Administration (FHA). 1934. Underwriting Manual, Washington, DC: US Government Printing Office.
- United States Department of Housing and Urban Development (HUD). 1977. Redlining: A Bibliography, 3rd ed., Washington, DC: HUD Library Division.
- Housing Finance Policy Center (HFPC)/Urban Institute. 2020. “An interactive view of the housing boom and bust”, Urban Institute [online], July. Accessed 1 November 2021, URL: https://apps.urban.org/features/mortgages-by-race.
- White, S. 2018. “The Investor’s Guide to Grading Indianapolis Neighborhoods”, BiggerPockets [online], August. Accessed 1 November 2021, URL: www.biggerpockets.com/blog/guide-grading-indianapolis-neighborhoods#356273.
- Wise, J. 2017. “Cleveland Neighborhood Grades”, BiggerPockets [online]. Accessed 1 November 2021, URL: www.biggerpockets.com/member-blogs/4704-do-you-really-need-a-mentor/42419-cleveland-neighborhood-grades.


