
A high risk for flooding
With four of its five boroughs located on islands off the coast of the continental United States, New York City is particularly vulnerable to coastal impacts of climate change. The New York City Panel on Climate Change (2019) outlines multiple climate-change risks, including increased coastal flooding, loss of natural salt marshes, saltwater intrusion into freshwater sources, increased beach erosion, and eventual permanent land inundation in certain regions (Gornitz et al. 2019).
Recently in the spotlight as the once-planned location for Amazon’s second headquarters (Goodman 2019), Long Island City remains an area of intense and concentrated residential and commercial development (Kensinger 2018; Curbed 2018). Long Island City is a neighborhood in the western portion of the borough of Queens, along the East River waterfront across from Midtown, Manhattan. With its proximity to Midtown and substantial transit infrastructure, in 2001 the city selected Long Island City as a site for significant potential growth and development, and 37 centrally located neighborhood blocks were rezoned to allow for increased density and new mixed-use development focused on residential, commercial, and light industrial business. Additional initiatives sought to improve neighborhood infrastructure by creating more attractive streetscapes, renovating subway stations, and improving traffic flow. The city also adopted new local tax and economic incentives (NYC Department of City Planning 2001).
New York adopted its first flood map in 1983 utilizing the Federal Emergency Management Agency’s (FEMA) flood insurance rate maps (FIRMs), which designate areas that are at 1% risk of annual flooding (a 100‑year flood zone). These FIRMs underwent minor updates in 2007 (NYC Department of City Planning 2018a). When Superstorm Sandy hit in 2012, the FIRMs placed 33 square miles of the city within a 100‑year flood zone. Unfortunately, flooding exceeded this 100‑year flood zone, with the flooded area of Queens alone almost double FEMA’s projections (PlaNYC 2013a). Updated preliminary flood insurance rate maps (PFIRMs) were released in 2013 and 2015 (NYC Department of City Planning 2018b). As Sandy exceeded the 100‑year flood zone, its impacts can be used as a baseline for preparedness related to future extreme weather events and flooding scenarios exacerbated by climate change.
The shoreline of Long Island City is a hardened sheltered bay plain, which includes low elevation with gradual slopes with reinforced shorelines of fine sediment. This shore type faces acute vulnerability to storm surge, as well as long-term vulnerability to sea-level rise (NYC Department of City Planning 2013). Newtown Creek and the East River provided the source for floodwaters into Long Island City, with waters from the East River mostly coming in via Anable Basin (the planned location of Amazon’s HQ2 (Kensinger 2018)). Up to six feet (1.8 m) of flooding occurred along 2nd Street, 5th Street, 51st Avenue, and Borden Avenue, causing damage to numerous buildings, though overall much of the neighborhood was not affected by floodwater (PlaNYCa 2013). Figure 1 illustrates the full extent of flooding inundation into Long Island City.
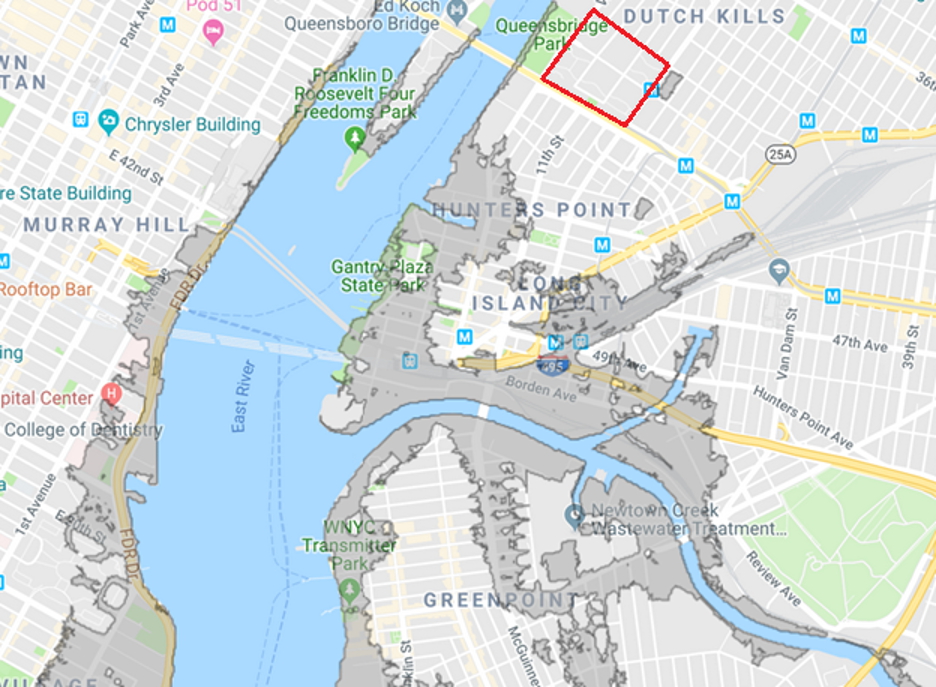
[Click image above to enlarge]
Source: NYC Open Data 2018 (“Sandy Inundation Zone”).
Vulnerable transportation infrastructure
Transportation infrastructure was particularly affected. All tubes and tunnels in and out of Manhattan experienced major flooding. The 53rd Street Tube (servicing the E and M trains) was flooded with half a million gallons of water, resulting in a week of closure. The Steinway Tube (servicing the 7 train) was flooded with a million gallons [1] of water, yielding six days of closure. The Rutgers Tube (servicing the F line) was flooded with 1.5 million gallons of water, closing for a week, and the Montague Tube (servicing the R line) was inundated with 23 million gallons of water, closing for 53 days. The Greenpoint Tube, servicing the G train between Brooklyn and Queens, was flooded with 3 million gallons of water and closed for 10 days. Other forms of transportation infrastructure were also affected. The Queens–Midtown Tunnel (servicing cars and buses) flooded with 12 million gallons of water, taking 10 days to fully reopen, and the LIRR East River Tunnels (servicing the Long Island Railroad and Amtrak) flooded with 13.6 million gallons of water, taking 12 days to fully reopen.
Damage to transportation infrastructure is continuous and compounding. In Amtrak’s East River Tunnel, seawater entered ventilation shafts, causing significant damage to signal, power, electrical, and mechanical systems. While the seawater was eventually pumped from the tunnels, the sulfates and chlorides left behind continue to cause component deterioration (HNTB 2014). Despite increasing train service delays due to this damage, repairs to all of Amtrak’s New York City tunnels, including those flooded in other parts of the city, will not begin until 2025 and will cost an estimated $1 billion (Castillo 2017).
Planning for resiliency
A meta-analysis of New York City policy and planning documents related to climate-change impacts, adaption, resilience, and environmental hazards found that low-income residents, the elderly, and ethnic minorities (in this order) face particular vulnerability (Reckien 2018). This vulnerability is not distributed evenly within the city. Census data from 2010 indicates that Long Island City residents have a relatively low poverty rate of 6%, especially in contrast to other neighborhoods along the Brooklyn–Queens waterfront (Greenpoint/Williamsburg had a poverty rate of 20%, Red Hook’s was 33%, and Brooklyn Navy Yard had 33% of residents in poverty) (PlaNYC 2013b). While Long Island City has a relatively low rate of poverty compared to some nearby neighborhoods, it is also home to Queensbridge Houses, the largest public housing project in the US. With around 6,000 residents, the median income value is only $15,483. (Kilgannon 2018). While Queensbridge Houses experienced no flooding inundation during Sandy (Figure 1), vulnerability still disproportionately affects its residents as a consequence of infrastructure damage, as well as the socioeconomic transformation of the neighborhood, described below.
Floodplain data from the 2015 FEMA PFIRM, in conjunction with NYC Department of Buildings permit data, show that the neighborhood cluster along the East River of Long Island City, Williamsburg, and Greenpoint has the largest number of new apartment units within a floodplain in the city. These neighborhoods combined yield 45% of the total units in the city being constructed in New York City floodplains. Long Island City is slated to have nearly 2,000 new permitted units (Rubin 2018). The average sales price in Long Island City has risen from $732,700 in 2012 to $1.1 million in 2017. While these new construction projects can internally mitigate flooding risks by placing mechanical systems and lobbies on higher floors, the neighborhoods remain vulnerable (Chen 2018).
The city has numerous long-term flooding resiliency projects planned and completed in Long Island City (Figure 2). These projects include drainage improvements for the West Side Yard and the East River Tunnels, flood protection for Newtown Creek, and construction of two new ferry landings. They also include natural-resource improvements, like construction of a park at Hunters Point South, as well as improving emergency services, including interim flood-protection measures and power redundancy for the local fire department (NYC Recovery 2016). To mitigate subway station flooding citywide, the city has recently tested deployable flexible walls for station entrances (Woodward 2019).

[Click image above to enlarge] Note: project completion status varies. Dark blue layering along shores represents the 100‑year floodplain from 2013 and 2015 PFIRMs produced by FEMA. Light blue layering along shores represents the 100‑year floodplain of the 2050s based on 90th‑percentile sea-level rise scenarios from the NYC Panel on Climate Change (NPCC) (2015).
Source: NYCityMap - NYC Recovery, Resiliency, and Mitigation Projects, project data obtained from the 2014 New York City Hazard Mitigation Plan (NYC Recovery 2016).
Conclusion
The development boom in Long Island City raises the question of the neighborhood’s long-term susceptibility to flooding damage. Many longtime and poorer residents of the area live in an area with relatively low flood risk, and many of the newer and wealthier residents live in new construction with built-in flood resiliency. That said, the fate of aging and damaged transportation infrastructure remains of immediate concern. Furthermore, worst-case climate scenarios emphasize the precarious position in which the city has placed this neighborhood, while designating it an area of focused development.
Bibliography
- Castillo, A. A. 2017. “Amtrak: Sandy tunnel repairs may begin in 2025, cost $1B”, Newsday, 19 October. Available online at the following URL: www.newsday.com/long-island/transportation/amtrak-sandy-tunnel-repairs-may-begin-in-2025-cost-1b-1.14539738.
- Chen, S. 2018. “New Buildings Rise in Flood Zones”, New York Times, 6 July. Available online at the following URL: www.nytimes.com/2018/07/06/realestate/luxury/new-buildings-rise-in-flood-zones.html.
- Curbed. 2018. “Long Island City’s thousands of incoming apartments, mapped”, 28 November. Available online at the following URL: https://ny.curbed.com/maps/long-island-city-development-boom-construction-map.
- NYC Department of City Planning. 2013. Coastal Climate Resilience. Urban Waterfront Adaptive Strategies (1–127). Available online at the following URL: https://www1.nyc.gov/assets/planning/download/pdf/plans-studies/sustainable-communities/climate-resilience/urban_waterfront.pdf.
- Goodman, J. D. 2019. “Amazon Pulls Out of Planned New York City Headquarters”, New York Times, 4 February. Available online at the following URL: www.nytimes.com/2019/02/14/nyregion/amazon-hq2-queens.html.
- Gornitz, V., Oppenheimer, M., Kopp, R., Orton, P., Buchanan, M., Lin, N., Horton, R. and Bader, D. 2019. “New York City Panel on Climate Change 2019 Report. Chapter 3: Sea-Level Rise”, Annals of the New York Academy of Sciences, vol. 1439, no. 1, pp. 71–94.
- HNTB. (2014). Structural Assessment of the Amtrak Under-River Tunnels in NYC Inundated by Super Storm Sandy (1–55) [New York City Under-River Tunnels Superstorm Sandy Impact Assessment], New York City: HNTB Corporation.
- Kensinger, N. 2018. “A walk around Anable Basin, Amazon’s future home in Queens”, Curbed, 29 November. Available online at the following URL: https://ny.curbed.com/2018/11/29/18117309/amazon-hq2-long-island-city-new-york-anable-basin-photo-essay.
- Kilgannon, C. 2018. “Amazon’s New Neighbor: The Nation’s Largest Housing Project”, New York Times, 12 November. Available online at the following URL: www.nytimes.com/2018/11/12/nyregion/amazon-queens-queensbridge-houses.html.
- NYC Department of City Planning. 2001. Long Island City Rezoning: Executive Summary, updated 2 October. Available online at the following URL: https://www1.nyc.gov/assets/planning/download/pdf/plans/long-island-city-mixed-use/lic.pdf.
- NYC Department of City Planning. 2018a. Resiliency FAQ Newsletter 2: Flood Maps – What does it mean to be in a “flood zone”?, March. Available online at the following URL: https://www1.nyc.gov/assets/planning/download/pdf/plans-studies/climate-resiliency/resiliency-newsletter-2-flood-zones.pdf.
- NYC Department of City Planning. 2018b. Resiliency FAQ Newsletter 3: Flood Maps – What is the status of NYC’s flood maps?, March. Available online at the following URL: https://www1.nyc.gov/assets/planning/download/pdf/plans-studies/climate-resiliency/resiliency-newsletter-3-flood-maps.pdf.
- NYC Open Data. 2018. Sandy Inundation Zone, 10 September. Accessed 23 April 2019, URL: https://data.cityofnewyork.us/Environment/Sandy-Inundation-Zone/uyj8-7rv5.
- NYC Maps. 2016. NYC Recovery, Resiliency, and Mitigation Projects. Accessed 23 April 2019, URL: https://maps.nyc.gov/resiliency.
- PlaNYC. 2013a. A Stronger, More Resilient New York. Sandy and its Impacts. 10–18. Available online at the following URL: https://www1.nyc.gov/assets/sirr/downloads/pdf/Ch_1_SandyImpacts_FINAL_singles.pdf.
- PlaNYC. 2013b. A Stronger, More Resilient New York. Brooklyn–Queens Waterfront. 238–268. Available online at the following URL: https://www1.nyc.gov/assets/sirr/downloads/pdf/Ch14_Brooklyn_Queens_FINAL_singles.pdf.
- Reckien, D. 2018. “What is in an index? Construction method, data metric, and weighting scheme determine the outcome of composite social vulnerability indices in New York City”, Regional Environmental Change, vol. 18, no. 5, pp. 1439–1451.
- Rubin, T. 2018. “Localize.City Finds 12 Percent of New Units Are Being Built on City’s Riskiest Land”, Localize Labs, 6 July. Accessed 10 February 2020, URL: http://labs.localize.city/developers-keep-flocking-to-flood-zones-localize-city-finds-12-percent-of-new-units-are-being-built-on-citys-riskiest-land.
- Woodward, A. 2019. “The MTA flooded a subway stop on purpose because ‘climate change is real.’ Here’s how it’s prepping New York for the next Superstorm Sandy”, Business Insider, 22 November. Available online at the following URL: www.businessinsider.com/mta-floods-new-york-subway-test-barrier-climate-change-2019-11.


